19.02.2026
433
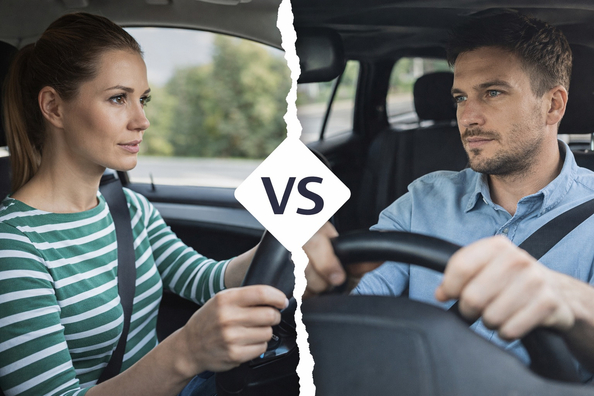

Provocative truth: the question “who’s better” is almost always replaced with “who shouts about it louder.” If you measure not with emotions but with data, the picture becomes less comfortable for self-confidence—and more useful for safety.
Let’s start with a cold shower of numbers. According to the Patrol Police of Ukraine, in 2025 there were 25,934 injury crashes recorded (3,249 killed; 31,898 injured). Among the key causes of severe crashes, exceeding safe/allowed speed is explicitly named (40.8% of severe crashes), as well as typical “mundane” violations—following distance, maneuvers, crosswalks, and intersections.
“In 2025… 25,934 injury crashes were recorded, in which 3,249 people died and 31,898 people were injured.”
There’s also scale on violations: in 2025, 4,695,171 tickets were issued by the automated enforcement system and 733,352 tickets—non-automatically. That’s a lot, and it shows the “temperature” of driving culture well. But—again—without a gender split.
A separate telling story is alcohol: in 2025, 643 injury crashes were recorded due to drivers being intoxicated (73 killed, 857 injured), and 138,047 administrative reports were filed for “drunk driving” (Parts 1–4 of Article 130 of the Code of Ukraine on Administrative Offenses). This is official statistics, but it doesn’t answer “men or women”—because sex is not provided in the public summary format.
For context: the Ministry of Internal Affairs of Ukraine publishes year-by-year crash reviews (for example, for 2024), featuring typical causes of severe crashes and some indicators related to intoxication. However, the focus there is on causes/types of crashes, not the driver’s gender profile.
The honest (and slightly irritating) conclusion for Ukraine: official open summaries tell us a lot about “how many” and “why,” but not “who by sex.” So any categorical claims like “in Ukraine women/men cause X times more crashes” without a transparent official source are either manipulation or cherry-picked analytics from fragments.
In the EU, the gender picture is measured better at least at the level of fatalities. Eurostat materials (CARE/Eurostat) show that over 2013–2023, men account for about three quarters of road accident fatalities.
“Men accounted for around three quarters of road accident fatalities between 2013 and 2023.”
Specifics for 2023: 15,678 male fatalities and 4,656 female fatalities in EU countries (the materials also note a small “unknown” share in some years).
To add “normalization” (at least per population), let’s use demographic estimates: as of 1 January 2024, the EU had about 220 million men and 229 million women. Based on this, we get a rough proxy of road fatality rate in 2023: approximately ~71 male fatalities versus ~20 female fatalities per 1 million population of the respective sex (an estimate, because the denominator is as of the start of 2024).
It’s important not to distort the meaning: this is statistics about victims (and partly about exposure—who drives more, what they drive, when), not about a “reward for skill.” Official road safety materials explicitly emphasize that correct risk comparisons require mileage data, which is often unavailable.
This is exactly where you can be “provocative but honest”: in Europe, there are sex-specific indicators of risky behavior, but they are often based on surveys (ESRA), not on a unified EU-wide fines database.
According to an SPI report by the European Road Safety Observatory (based on ESRA), the share of those who reported driving after drinking alcohol in the last 30 days differs substantially: 37% of men versus 13% of women. For driving “above the legal BAC limit”—19% of men versus 9% of women.
“Lower shares of females (13%)… compared to 37% of males.”
The same logic applies to “everyday” violations: in the distraction-at-the-wheel report, women less often than men admit handheld phone calls (27% vs 35%) and texting (23% vs 28%) in the last 30 days.
And finally fatigue—the least “heroic” factor, but one of the most dangerous: in Europe, on average 23% of drivers admit driving while critically sleepy in the last 30 days, and here too the sex gap is noticeable: 25% of men versus 16% of women.
And what about Ukraine? There are official figures on the volume of tickets (automated/non-automated) and on “drunk” crashes and reports, but there is no “m/f” breakdown in open summary statistics. So it’s impossible to build a correct comparative series like “violations per 1,000 drivers by sex” from official Ukrainian data—and it’s worth calling this a data-quality problem, not a “secret conspiracy.”
Scientific literature generally confirms what many people don’t want to admit in an argument: differences between men and women in driving are not about the “ability to hold the wheel,” but about average patterns of risk, exposure, and social roles. For example, reviews and empirical studies show that men (especially young men) more often demonstrate willingness to speed, commit violations, and drive under the influence of alcohol/substances, while women on average are more cautious about rules.
The key adjustment is mileage. A “quasi-induced exposure” study using Spain (2014–2017) showed two important things at once: women may represent a high share among license holders, but drive noticeably less and less often choose risky conditions (night, weekends, poor lighting). In their conclusions, the authors explicitly note that given license holding, women drive roughly “half as much” as men (as a generalization of their exposure estimates).
At the same time, even official European materials acknowledge: international statistics often don’t allow testing the hypothesis “men crash more only because they drive more,” because mileage data are rare; but detailed national studies show that the risk gap for young men persists even after adjusting for mileage.
There’s also an unpleasant (but important) nuance: some studies report that women may have a higher risk of certain injuries/hospitalization in a crash even with a lower overall crash risk—partly due to biomechanics, crash types, and the design of safety systems historically oriented toward an “average male.” So “taking fewer risks” doesn’t always mean “suffering less” once a crash has happened.
Now—a bit of provocation without rudeness. In real life, the battle of “who’s the better driver” often looks like this: one side appeals to “it’s inborn,” the other—to “I’m a mom, I’m careful.” Ukrainian media and local polls illustrate this perfectly: in people’s answers you hear both “men are born drivers,” and “women are more careful,” and a healthy “50/50.”
“Men are born drivers…” / “Sex doesn’t matter: both make mistakes.”
Stereotype works like a self-fulfilling prophecy: if someone is told for years that they’re “worse behind the wheel,” they will doubt longer, gain experience later, or avoid difficult conditions—and then that will be held against them. Gender and road safety researchers directly link risky road behavior to social expectations of “masculine” boldness and the devaluation of caution.

And now—to the specifics drivers love regardless of sex: if you’re arguing about who parks a BMW X5 G05 better (especially near a mall at peak time), the answer is often not in “gender,” but in a banal combination of visibility, experience, dimensions, and discipline. And yes, if your arguments end with you “improving the looks” of the car after minor incidents—body kits exist for this body: see body kits for BMW X5 G05.
Below is the promised table. It’s both useful and a bit irritating: because it’s exactly what shows where we have data and where it’s “I want to believe.”
| Key indicator | Men | Women | Comment on data quality |
|---|---|---|---|
| Crashes per 1,000 drivers | N/A (Ukraine, officially in open summaries) | N/A (Ukraine, officially in open summaries) | Public Ukrainian summaries have no gender breakdown of drivers/at-fault parties; therefore the denominator “drivers by sex” and the numerator “crashes by sex” cannot be matched. |
| Violations (proxy: self-reported risky actions, Europe) | Alcohol (after drinking, last 30 days): 37%; Handheld phone: 35%; Drowsy driving: 25% | Alcohol (after drinking, last 30 days): 13%; Handheld phone: 27%; Drowsy driving: 16% | This is not “fines per 1,000 drivers,” but ESRA/SPI survey indicators for cross-country comparability. |
| Average mileage | Higher (Spain example: female exposure ≈ 2x lower) | Lower (women avoid risky conditions more often) | EU aggregate “mileage by sex” as a standard is usually lacking; national studies show exposure differences. |
| Crash risk (proxy: road fatalities per 1 million population, EU, 2023) | ~71 deaths/1 million men | ~20 deaths/1 million women | Estimate based on road fatalities and population by sex; this is an outcome/exposure indicator, not “fault.” |
So who’s better? If “better” = “takes fewer risks and breaks rules less,” then average European trends and scientific reviews tip the scales toward women. If “better” = “has more experience in difficult conditions,” then the answer will more often be “the one who drives more,” and in many countries that is more often men. But if “better” = “fewer people die and get injured,” then the best driver has no sex at all: they have the habit of slowing down, not picking up the phone, and not getting behind the wheel after alcohol.
A question for you: when was the last time you honestly evaluated your own driving style on three points—speed, phone, fatigue—and what are you ready to change today to “win” not an argument, but a life?
Shipping to EU
Wholesale and retail
Own warehouse
Опис продукту
Подарунки не надаються при оформленні покупки у кредит під 0,01% або при покупці частинами.